IELTS Writing Task 1 | Describe a Graph | UK Transport 1990-2000
IELTS Writing Test | Task 1
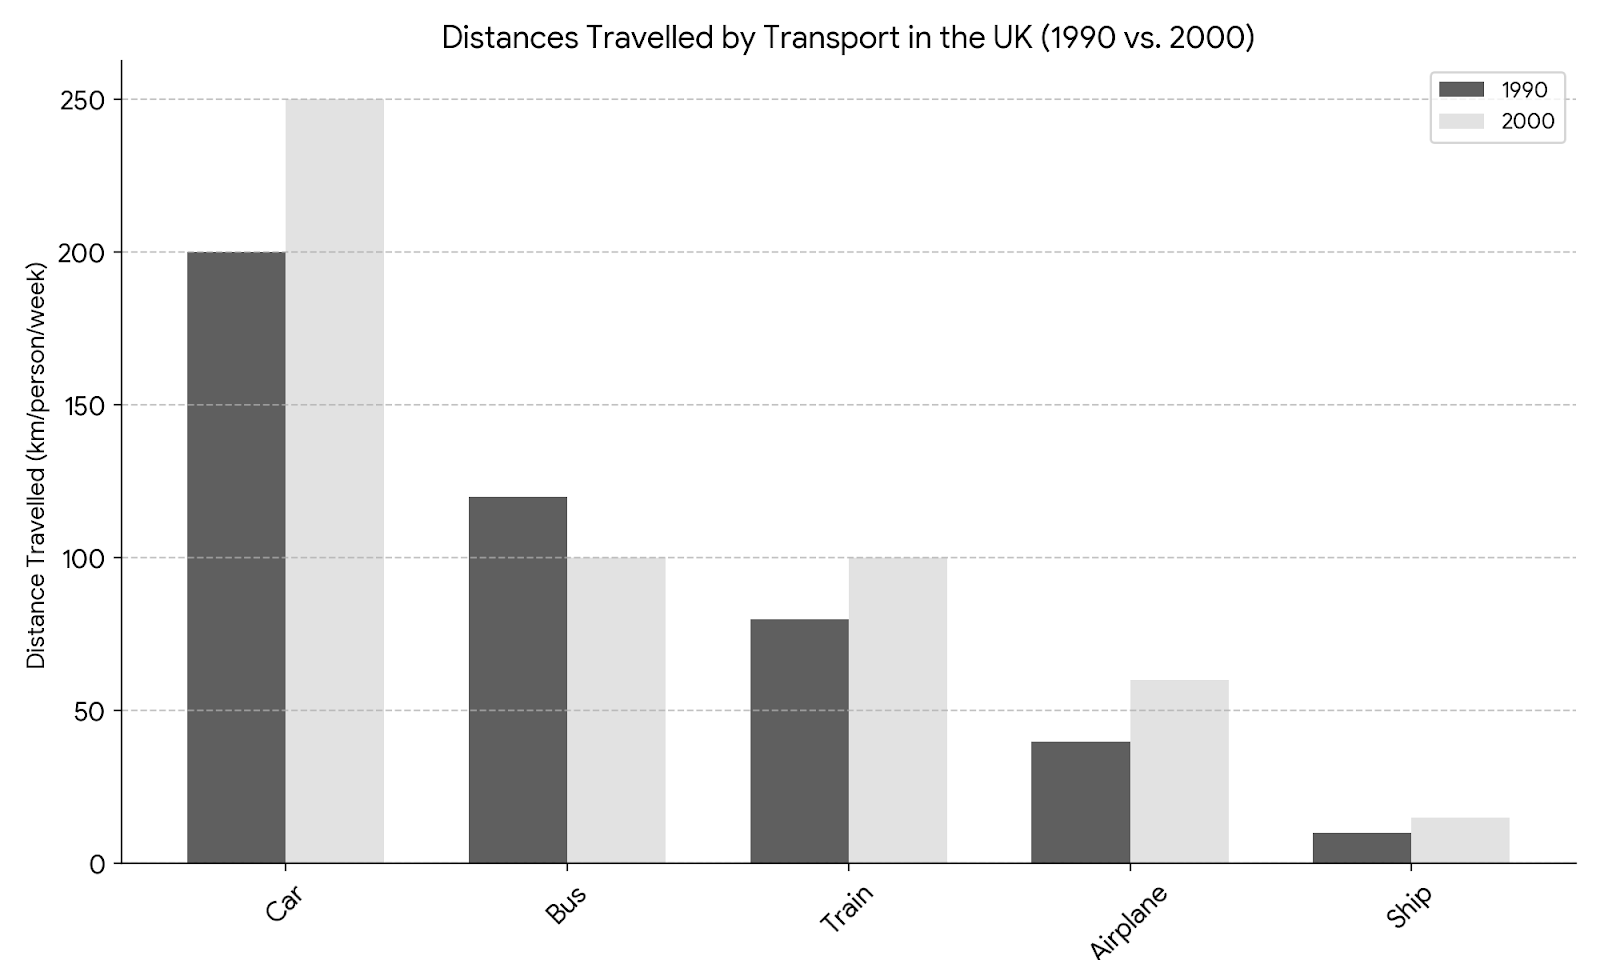
The graph illustrates the distances traveled by passengers on 5 types of transport in the UK in 1990 and 2000. The data is presented in kilometers per person, per week. Summarize the information by selecting and reporting the main features, and make comparisons where relevant.
Band 9 Answer
The bar chart depicts the average weekly travel distances per person across various modes of transport in the UK, comparing 1990 and 2000.
Overall, car travel saw a significant rise, while most other modes witnessed a decline or stagnation. In 1990, car travel stood out as the most popular choice, averaging 120 kilometers per person per week. This figure rose considerably to 180 kilometers by 2000, representing a 50% increase.
Conversely, local bus usage suffered a substantial drop, falling from 80 kilometers per week in 1990 to just 40 kilometers a decade later. Similarly, travel by train remained relatively stable, fluctuating between 40 and 50 kilometers across the two periods.
Notably, both walking and cycling registered a slight decrease, dropping from 10 kilometers and 5 kilometers to 8 kilometers and 4 kilometers, respectively.
This data suggests a growing preference for private car travel in the UK, potentially due to factors such as increased car ownership or improved road infrastructure.
Comments